Your APM and Observability Tool Is Probably Telling You Everything Except What Your Business Actually Wants to Know

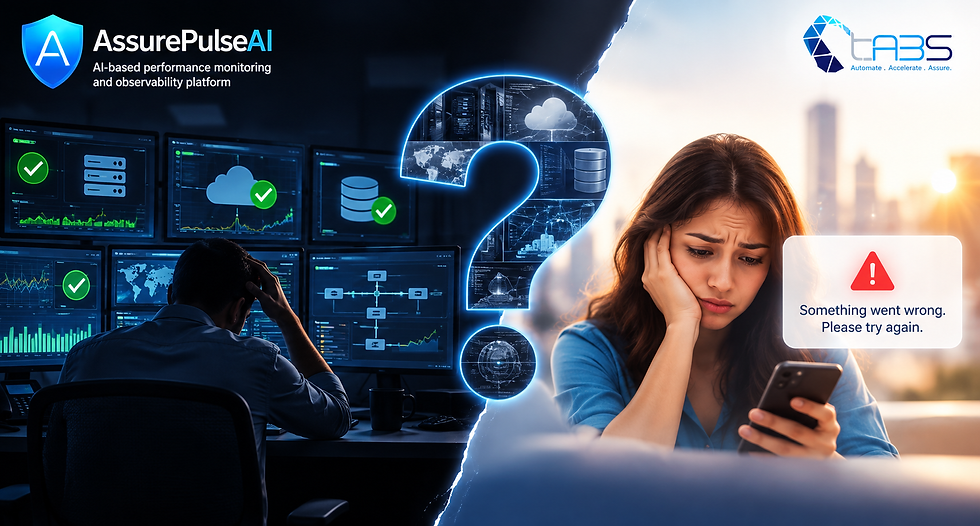
Your dashboards are green.
Your infrastructure is healthy.Your applications are available.Your database is responding.Your network is up.Your monitoring platform has collected millions of data points.
And yet your customer is staring at:
“Something went wrong. Please try again.”
That should make every CIO and CTO uncomfortable.
Because it raises a difficult question:
If everything is being monitored, why are we still struggling to understand what is actually going wrong?
Perhaps the enterprise observability problem isn't a lack of data.
Perhaps it is an excess of data and a shortage of intelligence.
We Have Built an Industry Around Watching Technology
Over the last decade, enterprises have invested billions in monitoring.
APM.Observability.Infrastructure monitoring.Network monitoring.Database monitoring.Log management.Cloud monitoring.Kubernetes monitoring.Synthetic monitoring.Security monitoring.
And then we built dashboards to visualize all of it.
And then dashboards for the dashboards.
We can now monitor almost everything.
But monitoring everything is not the same as understanding everything.
A CTO doesn't wake up in the morning asking:
“How many million metrics did we collect yesterday?”
They ask:
“Did our customers experience problems?”
“What impacted revenue?”
“Why did that transaction fail?”
“What is consuming my IT team's time?”
“Where is my technology estate becoming unnecessarily complex?”
“What should we fix before it becomes an incident?”
These are very different questions.
The Biggest Failure of Traditional Observability
Imagine a customer trying to make a payment.
The request travels through:
Customer → Web → API Gateway → Load Balancer → Application → Microservice → Middleware → Database → External Service
The payment fails.
The customer sees:
503 – Service Unavailable
Meanwhile, your monitoring systems report:
Server: HealthyCPU: NormalMemory: NormalNetwork: NormalDatabase: AvailableKubernetes: Healthy
Everything is green.
Except the customer.
This is the fundamental problem.
We have become very good at monitoring components.
We are not always equally good at understanding experiences.
APM Shouldn't Begin With CPU
This may sound controversial:
APM shouldn't begin with infrastructure. It should begin with the customer transaction.
Start with:
What was the customer trying to do?
Then follow the transaction.
Where did it slow down?
Where did it fail?
Which dependency contributed to it?
What changed?
What is the business impact?
And finally:
What should we do?
That is observability with context.
Your IT Team Doesn't Need Another Dashboard
During a major production incident, how many dashboards does your team open?
Application dashboard.
Infrastructure dashboard.
Database dashboard.
Network dashboard.
Kubernetes dashboard.
Log dashboard.
Cloud dashboard.
Security dashboard.
Then someone starts searching through logs.
Someone asks:
“Did anyone deploy anything?”
Another asks:
“Can the database team check blocking?”
Someone else says:
“Network looks fine.”
And 45 minutes later, everyone has a lot of information.
But nobody has the answer.
This is not an information problem.
It is a correlation problem.
A modern observability platform should not force ten teams to interpret ten different dashboards.
It should connect the dots.
One Incident Can Create 500 Alerts
Consider a database query that suddenly becomes inefficient.
The query slows down.
↓
Database latency increases.
↓
Application response time increases.
↓
API latency increases.
↓
Transactions start timing out.
↓
503 errors increase.
↓
Customers retry.
↓
Traffic increases.
↓
More alerts are generated.
You could end up with hundreds of alerts.
But perhaps there is only one underlying problem.
The enterprise doesn't need 500 notifications.
It needs one intelligent explanation:
“These events are correlated. The likely root cause is this database performance degradation, which began after this change and is affecting these business transactions.”
That's the difference between alerting and understanding.
Complexity Has Become the New IT Debt
Enterprises talk extensively about technical debt.
But there is another form of debt quietly growing:
Observability Debt
Every new platform adds:
Another agent
Another data pipeline
Another dashboard
Another integration
Another contract
Another skill requirement
Another alerting mechanism
Another operational dependency
Eventually, the organization has ten tools trying to explain the same environment.
The irony?
The more tools you deploy, the harder it can become to understand the whole system.
The question should no longer be:
“How much can we monitor?”
It should be:
“How much complexity can we eliminate?”
The Enterprise Should Be Able to Zoom Out — and Zoom In
A modern observability platform should allow a CTO to see:
Business
Which business services are impacted?
↓
Application
Which applications are affected?
↓
Transaction
Which transactions are failing?
↓
Service
Which service is responsible?
↓
Infrastructure
Which server/container/network component is involved?
↓
Database
Which database operation is responsible?
↓
Query
Which query or execution pattern is causing the problem?
And then go back up.
Query → Database → Application → Transaction → Customer → Business
That is how you make complexity understandable.
Observability Should Connect Technology to Money
A CPU spike is a technical event.
A failed payment is a business event.
A database lock is a technical event.
A failed loan application is a business event.
An API timeout is a technical event.
A customer abandoning a transaction is a business event.
The real opportunity is connecting:
Technical Signal
↓
Service Impact
↓
Customer Impact
↓
Business Impact
Imagine the CTO receiving:
Payment transactions are experiencing increased latency. Two downstream services are affected. Transaction failures have increased by 6%. The degradation began shortly after a deployment. The primary contributing dependency is a database query with a significant increase in execution time.
Now that is useful information.
Compare it with:
CPU utilization exceeded 85%.
One is a metric.
The other is intelligence.
AI Shouldn't Be a Chatbot Sitting Beside Your Dashboard
This is another uncomfortable question for the industry.
What exactly does “AI-powered observability” mean?
If AI simply summarizes the dashboards you already have, it isn't fundamentally changing observability.
The real opportunity is much bigger.
AI should help answer:
What happened?
Why did it happen?
What changed?
What is connected to it?
What is impacted?
What is likely to happen next?
What should we investigate?
What should we optimize?
Can we prevent it?
AI should reduce the amount of human reasoning required to navigate enterprise complexity.
The Next Generation of Observability Should Optimize — Not Just Observe
Imagine your platform identifying:
Database
“This query is consuming disproportionate resources.”
Infrastructure
“This server is consistently overprovisioned.”
Configuration
“This configuration is contributing to performance degradation.”
Capacity
“This workload is approaching its safe operating threshold.”
Application
“This transaction is degrading after the latest deployment.”
Dependency
“This external service is contributing to application latency.”
That changes the role of observability.
It moves from:
Watch → Alert → Investigate
to:
Understand → Recommend → Optimize → Prevent
This Is Where We Believe AI-Native Observability Begins
This is the philosophy behind AssurePulseAI.
Not:
“Let's build another monitoring dashboard.”
But:
“Let's build a system that understands the relationships between the signals.”
AssurePulseAI is built around the idea that enterprise observability should bring together the different layers of the technology estate rather than forcing teams to operate them as isolated silos.
From:
Network
→ Infrastructure
→ Applications
→ Transactions
→ Databases
→ Business Services
And then use AI to help connect the dots.
The objective is not to collect everything simply because we can.
It is to identify what matters, what is connected, what is changing, and what requires action.
From Observability to AI-Native Observability
For us, the evolution looks like this:
Monitoring
Is it up?
↓
APM
Which application or transaction is slow?
↓
Observability
What is connected and why is it slow?
↓
Intelligent Observability
What is the probable root cause and what is impacted?
↓
AI-Native Observability
What happened, why did it happen, what will happen next, and what should we do?
That last step is where the real transformation happens.
AssurePulseAI's Bigger Idea
AssurePulseAI is being built around several principles:
1. Start With Experience
Understand the customer transaction, not just the infrastructure underneath it.
2. Break Down Complexity
Move from business service to application, server, network and database — and drill down to the relevant transaction or query.
3. Correlate Before You Alert
Understand relationships between signals rather than treating every event as an independent incident.
4. Find the Root Cause
Move beyond symptoms and help identify the underlying contributor.
5. Optimize Continuously
Use AI to identify opportunities in database performance, system configuration and capacity.
6. Consolidate Visibility
Reduce the need to stitch together multiple technology silos just to understand one business service.
7. Keep Humans in Control
AI should accelerate investigation and decision-making.
It should not replace engineering judgment.
The Real Measure of Observability
Maybe it is time for enterprises to stop measuring observability by:
Number of metrics collected.
Number of dashboards.
Number of integrations.
Number of logs ingested.
Number of alerts generated.
Instead, measure:
How many customer-impacting incidents did we prevent?
How quickly can we identify root cause?
How much IT time did we save?
How much technology complexity did we remove?
How much IT debt did we consolidate?
How much infrastructure and database waste did we eliminate?
How much faster can our teams make decisions?
Those are the metrics that matter.
Perhaps the Future of Observability Is Less Observability
That may sound contradictory.
But consider this:
The best observability experience may be the one where the IT team doesn't have to search through thousands of signals.
They don't need to know everything.
They need to know what matters.
They don't need 500 alerts.
They need the five events that require attention.
They don't need ten dashboards.
They need one connected view of the business service.
They don't need another tool telling them something is wrong.
They need help understanding:
What happened.
Why it happened.
Who is impacted.
What happens next.
And what should we do about it?
The Question Every CIO and CTO Should Ask
The next time someone presents an APM or Observability platform, don't ask:
“How many metrics can it collect?”
Ask:
“Can it tell me which customer is impacted?”
Ask:
“Can it follow the transaction across my technology estate?”
Ask:
“Can it distinguish a symptom from a root cause?”
Ask:
“Can it explain the business impact?”
Ask:
“Can it reduce the workload on my IT teams?”
Ask:
“Can it identify what I should optimize?”
And perhaps the most important question:
“After deploying this platform, will my technology environment actually become easier to understand?”
Because enterprises don't need more noise.
They don't need more dashboards.
They don't need more alerts.
They need clarity.
They need context.
They need intelligence.
They need action.
That is the promise of AI-Native Observability.
And that is the problem we are trying to solve with AssurePulseAI.


Comments