APM Observability: Let Data Guide You to Exceptional End User Experience


"Your users don't care about CPU utilisation, memory consumption, or database locks. They care about one thing: Does the application work when they need it?"
In today's digital economy, every click, transaction, API call, and customer interaction defines your brand. Whether you're a bank processing millions of payments, a retailer handling festive season traffic, or a healthcare provider delivering critical patient services, the quality of your digital experience directly impacts customer trust and business growth.
The challenge is that modern applications have become incredibly complex.
A single customer request may travel through web servers, application servers, APIs, microservices, containers, Kubernetes clusters, databases, message queues, cloud services, and third-party integrations before a response reaches the user. Any delay in this chain can lead to slow response times, transaction failures, abandoned shopping carts, or dissatisfied customers.
This is where Application Performance Monitoring (APM) and Observability become indispensable.
Beyond Monitoring: Why Observability Matters
Traditional monitoring tells you what has failed.
Observability helps you understand:
Why it failed
Where it failed
How it impacts users
What should be fixed first
How to prevent it from happening again
Instead of reacting to incidents, organisations gain the ability to predict, analyse, and resolve issues before customers even notice them.
The difference is significant.
Monitoring raises alarms.
Observability provides answers.
Data is the Most Valuable Asset
Every application continuously generates valuable operational data.
This includes:
User transactions
Response times
API latency
Error rates
Infrastructure utilisation
Database performance
Network behaviour
Security events
Business transactions
Application logs
Distributed traces
Cloud resource metrics
Individually, these datasets provide only partial visibility.
When correlated together, they reveal the complete story of an application's health.
The organisations that leverage this data effectively make faster decisions, minimise downtime, optimise performance, and consistently deliver superior customer experiences.
End User Experience Starts with Visibility
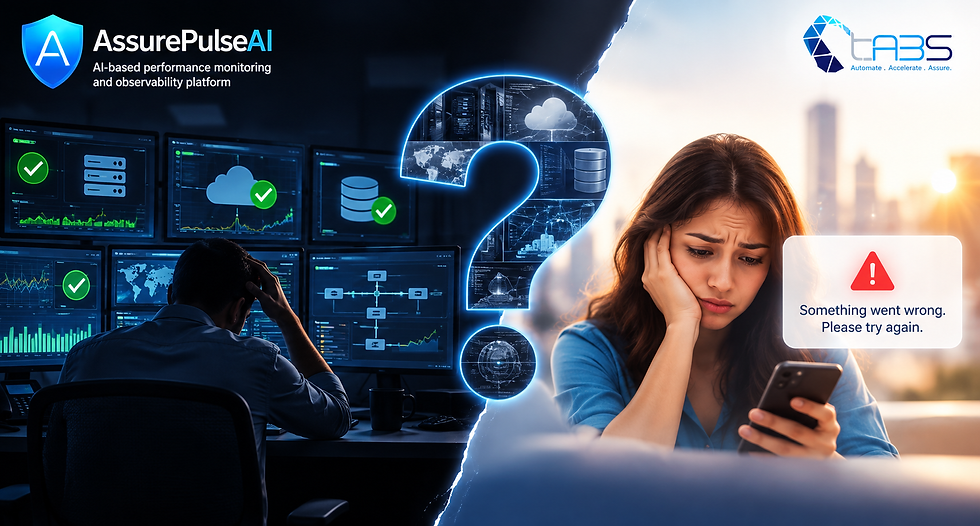
Most organisations discover issues only after customers begin reporting them.
By then:
Revenue may already be lost.
SLAs may already be breached.
Brand reputation may already be impacted.
A modern observability platform continuously analyses application behaviour from the end user's perspective.
It answers questions such as:
Are users experiencing slow page loads?
Which APIs are causing delays?
Which database query is affecting checkout?
Is the issue limited to one region?
Is the problem infrastructure, application, database, or network related?
Which business service is impacted?
Instead of searching across multiple tools, engineering teams receive a unified, data-driven view.
Correlating Data Across the Entire Technology Stack
Real business insights emerge when data is connected rather than viewed in isolation.
For example:
A payment transaction becomes slow.
Rather than simply displaying high response times, an observability platform correlates:
User transaction latency
Application response time
API execution
Distributed traces
Database query performance
Network latency
Container health
Kubernetes events
Server resource utilisation
Recent deployments
Security alerts
Within minutes, operations teams can identify the root cause instead of spending hours manually analysing logs across multiple systems.
This dramatically reduces Mean Time to Detect (MTTD) and Mean Time to Resolve (MTTR).
AI Makes Observability Smarter
Modern observability platforms increasingly use Artificial Intelligence to move from reactive monitoring to proactive operations.
AI can automatically:
Detect abnormal behaviour
Learn application baselines
Predict outages before they occur
Identify root causes
Prioritise alerts
Eliminate alert fatigue
Recommend corrective actions
Forecast capacity requirements
Rather than generating thousands of alerts, AI helps engineering teams focus on the few issues that genuinely affect customers and business outcomes.
From Technical Metrics to Business Insights
Executives don't make decisions based on CPU graphs.
They care about business impact.
Modern observability connects technical health with business performance.
For example:
Instead of saying:
"Database CPU reached 90%."
Observability explains:
"Checkout transactions increased by 4.2 seconds, causing an estimated 12% drop in completed purchases during peak traffic."
This enables business leaders and IT teams to prioritise actions based on measurable customer and financial impact.
The Shift from Multiple Tools to One Unified Platform
Many organisations rely on separate tools for:
Infrastructure Monitoring
APM
Log Analytics
Network Monitoring
Database Monitoring
Cloud Monitoring
Asset Management
Security Monitoring
The result is fragmented visibility, duplicated effort, higher licensing costs, and slower incident response.
A unified observability platform consolidates these capabilities into a single pane of glass, allowing teams to correlate data seamlessly across the entire technology landscape.
The outcome is:
Faster troubleshooting
Better collaboration
Lower operational costs
Improved governance
Simplified management
Enhanced customer satisfaction
Building a Data-Driven Culture
Observability is not just a technology initiative; it is a strategic capability.
Organisations that embrace data-driven operations benefit from:
Improved application availability
Reduced downtime
Faster incident resolution
Better capacity planning
Stronger operational resilience
Increased customer satisfaction
Higher employee productivity
Better business decision-making
Every operational decision becomes grounded in measurable evidence rather than assumptions.
Exceptional digital experiences are not created by chance.
They are built on visibility, intelligence, and actionable insights.
The organisations that succeed tomorrow will be those that continuously observe, analyse, predict, and optimise every customer interaction using data.
Application Performance Monitoring and Observability transform raw operational data into meaningful business intelligence, enabling teams to move beyond simply keeping systems running to consistently delivering exceptional end-user experiences.
Because in today's digital world, every millisecond matters—and every data point tells a story.
About AssurePulseAI
AssurePulseAI is an AI-native observability platform that delivers end-to-end visibility across applications, infrastructure, databases, cloud environments, networks, security, and business transactions through a single unified platform. By combining APM, observability, AI-driven analytics, synthetic monitoring, asset management, and predictive insights, AssurePulseAI empowers organisations to detect issues early, resolve incidents faster, optimise performance continuously, and deliver outstanding digital experiences for every user.

Comments