Less Is More: Why Too Much APM and Observability Can Hurt Your Business

The Case for Intelligent Observability Over Infinite Telemetry
"The goal of observability isn't to collect more data. It's to make better decisions."
Over the past decade, Application Performance Monitoring (APM) and Observability platforms have evolved dramatically. Vendors have competed to collect more metrics, more logs, more traces, more events, and more telemetry than ever before.
At first glance, this seems like progress.
After all, more data should mean better visibility.
But in reality, many organisations are discovering the opposite.
Too much monitoring often creates more problems than it solves.
Instead of faster troubleshooting, IT teams face alert fatigue, rising infrastructure costs, slower applications, expensive data storage, and increasingly complex investigations.
The question enterprises should be asking is no longer:
"How much data can we collect?"
It should be:
"What is the minimum data required to solve the problem quickly?"
That is the philosophy behind intelligent, AI-native observability.
The Data Explosion
A modern enterprise application can generate millions of telemetry events every hour.
Every request may produce:
Infrastructure metrics
Application metrics
JVM metrics
Container metrics
Kubernetes metrics
Network metrics
Database metrics
API traces
Distributed traces
Application logs
Security logs
Audit events
Business events
Multiply that across hundreds of applications, thousands of servers, cloud services, containers, databases, and microservices, and the volume becomes enormous.
More data sounds useful.
But more data also means:
More storage
Higher licensing costs
More network traffic
Higher CPU utilisation
Increased memory consumption
Longer search times
More dashboards
More alerts
Eventually, teams spend more time managing observability than improving application performance.
The Hidden Cost of Heavy Agents
Most organisations rarely ask an important question:
What is the monitoring platform doing to my production servers?
Every monitoring agent consumes resources.
Each agent typically performs:
Metric collection
Log collection
Trace generation
Process monitoring
File system monitoring
Network monitoring
Configuration monitoring
Each activity consumes:
CPU cycles
Memory
Disk I/O
Network bandwidth
One lightweight agent may have minimal impact.
However, multiple monitoring agents running simultaneously—APM, infrastructure monitoring, log collectors, security agents, endpoint tools, and cloud monitoring agents—can collectively consume significant server resources.
Ironically, organisations sometimes degrade application performance in the name of monitoring application performance.
More Dashboards Don't Mean Faster Resolution
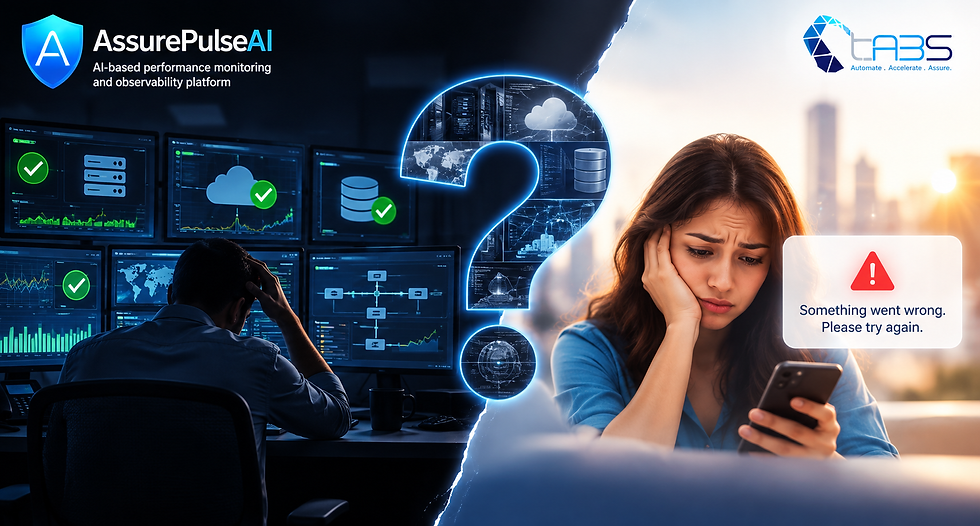
When an application slows down, engineers shouldn't have to navigate through multiple dashboards to find the answer.
A typical investigation often involves switching between:
Infrastructure dashboards
APM consoles
Log analytics
Distributed tracing
Kubernetes dashboards
Database monitoring
Cloud portals
Network monitoring
Security consoles
Each tool provides one piece of the puzzle.
The engineer becomes the integration layer.
The result is dozens of clicks, multiple browser tabs, and valuable time spent correlating information instead of resolving the issue.
The problem isn't a lack of data.
The problem is a lack of context.
Observability Should Reduce Complexity—Not Create It
The purpose of observability is to shorten the path from incident to resolution, not increase the number of dashboards.
The ideal investigation should be:
Alert → Business Impact → Root Cause → Recommended Action
Not:
Alert → Dashboard → Logs → Traces → Infrastructure → Database → Kubernetes → Cloud Console → Root Cause
Every additional click increases investigation time and delays resolution.
The best observability platform is the one that gets engineers to the answer first.
The Signal-to-Noise Problem
Collecting everything creates another challenge.
Noise.
Thousands of alerts.
Millions of metrics.
Billions of log entries.
The truly important information becomes buried beneath operational clutter.
Modern observability must prioritise signal over noise.
The objective isn't to see everything.
It's to see what matters most.
The Right Data Beats All the Data
Every application has a relatively small number of indicators that truly determine customer experience.
Instead of collecting thousands of metrics every second, organisations need visibility into what actually impacts business performance:
Response time
Transaction failures
API latency
Database bottlenecks
Infrastructure saturation
Business transaction success
Capacity trends
Everything else should support these insights—not overwhelm them.
Collecting the right data reduces storage costs, lowers infrastructure overhead, simplifies investigations, and accelerates root cause analysis.
AI Changes the Equation
Artificial Intelligence enables organisations to collect and analyse telemetry intelligently.
Instead of storing everything forever, AI can:
Detect anomalies
Correlate related events
Eliminate duplicate alerts
Suppress operational noise
Learn normal behaviour
Surface only the most relevant insights
Engineers no longer need to analyse millions of telemetry points.
They receive meaningful insights, prioritised recommendations, and probable root causes within seconds.
AI-Native Observability: From Data to Decisions
Collecting more telemetry doesn't automatically lead to better decisions.
Traditional APM platforms generate thousands of metrics, logs, and traces, leaving engineers to determine what's important. An AI-native observability platform transforms raw telemetry into actionable intelligence.
Instead of simply answering what happened, AI answers:
Why did it happen?
What is the business impact?
What should be fixed first?
How can it be prevented?
This enables engineering teams to make faster, smarter, and more confident decisions while reducing Mean Time to Detect (MTTD) and Mean Time to Resolve (MTTR).
Continuous Application Fine-Tuning with AI
Applications are constantly evolving—and so are their performance characteristics.
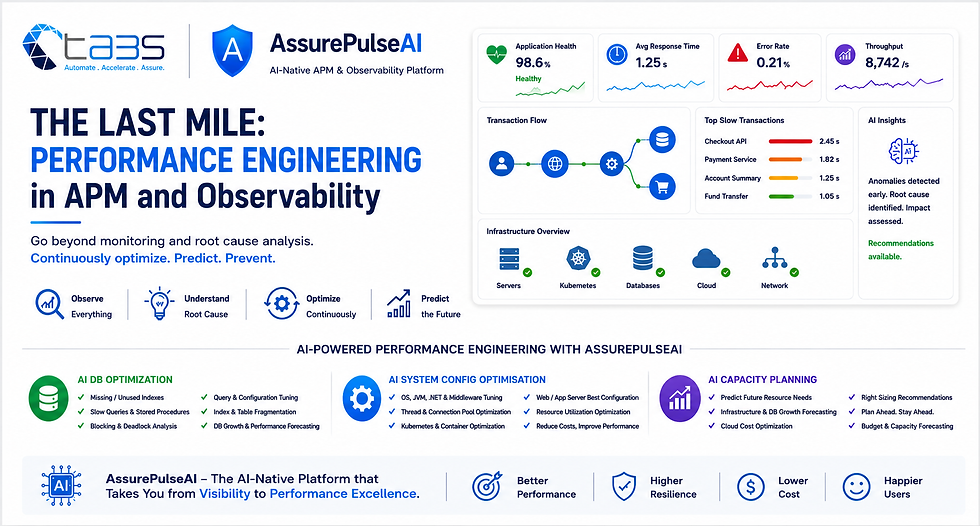
Rather than waiting for issues to impact users, AssurePulseAI continuously analyses production workloads and recommends improvements across the technology stack.
Its AI engine helps optimise:
Database performance
Application and system configuration
API performance
Infrastructure utilisation
Kubernetes resources
Capacity planning
By continuously learning from production behaviour, AssurePulseAI enables organisations to fine-tune applications, improve response times, optimise resource utilisation, and reduce operational costs—without relying solely on manual performance analysis.
Fewer Clicks. Faster Answers.
Imagine an executive asking:
"Why are customers experiencing slow payments?"
Traditional approach:
Open APM dashboard
Open Infrastructure dashboard
Search logs
View traces
Check Kubernetes
Check database
Review cloud metrics
Twenty minutes later...
The answer finally appears.
With an AI-native observability platform like AssurePulseAI, the platform immediately explains:
Payment API latency increased because a database index became fragmented, causing query execution time to increase by 220%. Estimated customer impact: 18% slower payment completion. Recommended action: Rebuild the affected index. Expected improvement: 37%.
One screen.
One explanation.
One recommendation.
That is intelligent observability.
Why AssurePulseAI Takes a Different Approach
At AssurePulseAI, we believe observability should simplify operations—not complicate them.
Our AI-native platform is built on four core principles:
Collect the Right Data
Focus on high-value telemetry instead of overwhelming teams with unnecessary metrics.
Minimise Agent Overhead
Lightweight telemetry collection reduces CPU, memory, disk, and network utilisation, ensuring monitoring never impacts application performance.
Reduce Investigation Time
Applications, infrastructure, databases, cloud services, Kubernetes, networks, and business transactions are correlated into a unified operational view—eliminating the need to jump between multiple tools.
Optimise Continuously with AI
Beyond monitoring, AssurePulseAI provides AI-powered Database Optimisation, System Configuration Optimisation, Capacity Planning, Root Cause Analysis, and Performance Engineering recommendations to continuously improve application performance.
For years, the industry believed more telemetry meant better observability.
Today, the challenge isn't collecting more data—it's making sense of the data that matters.
Collecting excessive telemetry increases infrastructure costs, consumes valuable server resources, creates alert fatigue, and often makes troubleshooting more complex than it needs to be.
The future of APM and Observability belongs to AI-native platforms that collect the right data, correlate it intelligently, and provide clear, actionable recommendations.
At AssurePulseAI, we've built an AI-native APM, Observability, and Performance Engineering platform that goes beyond monitoring. By combining lightweight telemetry collection, AI-powered root cause analysis, AI Database Optimisation, AI System Configuration Optimisation, AI Capacity Planning, and continuous application fine-tuning, AssurePulseAI helps organisations make better decisions, resolve incidents faster, optimise performance proactively, and deliver exceptional digital experiences.
Because the best observability platform isn't the one that collects the most data—it's the one that helps you make the right decision in the fewest clicks.

Comments