Real-Time Application Monitoring: How Fast Can You Respond?


"It's not the outage that hurts your business the most—it's how long it takes you to discover and resolve it."
In an always-connected world, users expect applications to respond instantly. Whether they're making an online payment, booking a flight, trading stocks, or accessing healthcare records, every second counts.
Research consistently shows that users abandon slow applications, businesses lose revenue during outages, and customer trust erodes with every minute of downtime.
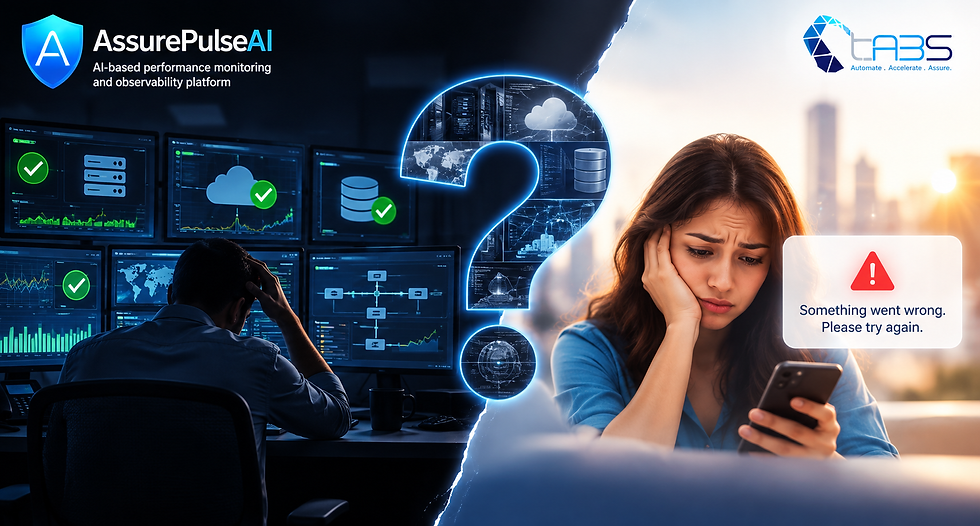
The real question isn't whether an incident will occur. It's how quickly your organisation can detect it, understand it, and respond.
This is where Real-Time Application Monitoring becomes a strategic advantage rather than just an operational necessity.
The Speed of Business Demands the Speed of Insight
Modern enterprises operate in real time.
Every second, applications generate thousands—or even millions—of events:
Customer transactions
API requests
Database queries
Authentication events
Infrastructure metrics
Network traffic
Application logs
Security alerts
Cloud events
Hidden within this stream of telemetry are the earliest signs of performance degradation.
A slow database query.
An overloaded Kubernetes pod.
A failing API.
A memory leak.
A network bottleneck.
If these signals are detected immediately, users may never notice.
If they are missed, a minor issue can quickly escalate into a major business outage.
Traditional Monitoring Isn't Fast Enough
Many organisations still rely on static thresholds and periodic polling.
Typical monitoring might check:
CPU every minute
Memory every five minutes
Disk utilisation every ten minutes
Unfortunately, today's digital services don't fail on predictable schedules.
A payment gateway can fail within seconds.
A database connection pool can become exhausted in less than a minute.
A microservice deployment can introduce latency instantly.
By the time traditional monitoring detects the issue, customers may already be affected.
Real-time monitoring changes this completely.
What Does Real-Time Monitoring Mean?
Real-time monitoring is the continuous collection, processing, correlation, and analysis of telemetry data as it is generated.
Rather than waiting for scheduled checks, modern platforms continuously monitor:
Application response times
API latency
Error rates
Transaction throughput
User experience
Database performance
Infrastructure health
Kubernetes workloads
Cloud services
Network behaviour
This enables engineering teams to identify issues within seconds rather than minutes.
Every Second Matters
Imagine an online banking application.
A customer initiates a fund transfer.
Within milliseconds:
The web application receives the request.
Authentication validates the customer.
Multiple APIs exchange information.
Fraud detection analyses the transaction.
Database updates are committed.
Notification services send confirmations.
If one service slows down by just two seconds, the customer notices.
If it fails entirely, the transaction may be abandoned.
Without real-time visibility, IT teams may spend hours identifying which component caused the delay.
With modern observability, the root cause is visible almost instantly.
The Journey from Detection to Resolution
Effective incident management follows four key stages:
1. Detect
Identify anomalies as they occur.
Examples include:
Response time spikes
Increased error rates
Failed transactions
Resource exhaustion
Network latency
2. Diagnose
Correlate data from across the technology stack.
This includes:
Metrics
Logs
Distributed traces
Infrastructure health
Database activity
Kubernetes events
Cloud services
Instead of isolated alerts, teams receive complete context.
3. Decide
Artificial Intelligence analyses historical behaviour, identifies probable root causes, prioritises incidents, and recommends actions.
Instead of asking:
"What happened?"
Teams immediately know:
"Why did it happen?"
4. Resolve
Engineering teams fix the issue before it impacts a larger number of users.
The result:
Reduced Mean Time to Detect (MTTD)
Reduced Mean Time to Resolve (MTTR)
Higher availability
Better customer satisfaction
Real-Time Monitoring Isn't Just About Infrastructure
The most important metric isn't CPU utilisation.
It's customer experience.
Modern observability focuses on business outcomes by monitoring:
Login success rates
Payment completion times
Shopping cart abandonment
Claims processing
Loan approvals
Healthcare transactions
Manufacturing workflows
Technical metrics become meaningful when linked to business impact.
For example, instead of reporting:
"Database CPU reached 90%."
A modern observability platform explains:
"Checkout response times increased by 3.8 seconds, resulting in a 15% increase in abandoned carts during peak traffic."
This context enables faster, smarter decision-making.
AI Accelerates Incident Response
As environments become more distributed, the volume of telemetry data grows exponentially.
Humans alone cannot analyse millions of events every minute.
Artificial Intelligence bridges this gap by:
Detecting anomalies automatically
Learning application baselines
Predicting failures before they occur
Correlating related alerts
Eliminating alert fatigue
Identifying probable root causes
Recommending remediation actions
Instead of overwhelming operations teams with thousands of alerts, AI highlights the few issues that truly matter.
From Reactive Operations to Predictive Performance
Real-time monitoring enables organisations to move through four levels of operational maturity:

The future of observability lies in intelligent automation, where systems not only identify problems but also assist in resolving them.
Why a Unified Platform Matters
Many enterprises still use separate tools for:
Infrastructure monitoring
Application Performance Monitoring (APM)
Log analytics
Network monitoring
Database monitoring
Security monitoring
Cloud monitoring
This fragmented approach slows down incident response.
A unified observability platform correlates all telemetry into a single, comprehensive view.
Benefits include:
Faster root cause analysis
Reduced operational complexity
Lower tooling costs
Improved collaboration across IT teams
Better governance and compliance
Enhanced end-user experience
How AssurePulseAI Delivers Real-Time Intelligence
At AssurePulseAI, we believe observability should empower organisations to act before customers are affected.
Our AI-native platform provides:
Real-time Application Performance Monitoring (APM) across modern and legacy applications.
End-to-end distributed tracing for complete transaction visibility.
Infrastructure monitoring across servers, cloud environments, containers, Kubernetes, databases, and networks.
AI-powered anomaly detection and intelligent alerting to reduce noise and focus on critical issues.
Business transaction monitoring that links technical performance to customer outcomes.
Predictive analytics and capacity planning to anticipate demand and prevent resource bottlenecks.
Unified dashboards that consolidate metrics, logs, traces, events, and business KPIs into a single pane of glass.
With AssurePulseAI, organisations move beyond reactive monitoring to achieve proactive, intelligent operations that improve reliability, reduce downtime, and enhance digital experiences.
Digital businesses are measured in milliseconds.
Customers won't wait for slow applications.
Executives won't accept prolonged outages.
Operations teams can't afford hours of troubleshooting.
The organisations that succeed are those that can detect problems instantly, understand them quickly, and resolve them before users are impacted.
Real-time application monitoring isn't about collecting more data—it's about transforming data into immediate action.
Because in today's digital economy, your response time is your competitive advantage.
About AssurePulseAI
AssurePulseAI is an AI-native Application Performance Monitoring and Observability platform developed by Ta3s. It delivers comprehensive visibility across applications, infrastructure, databases, cloud environments, Kubernetes, networks, and business transactions. By combining real-time monitoring, AI-driven analytics, predictive insights, and unified observability, AssurePulseAI helps enterprises reduce downtime, accelerate incident response, optimise performance, and deliver exceptional end-user experiences.

Comments